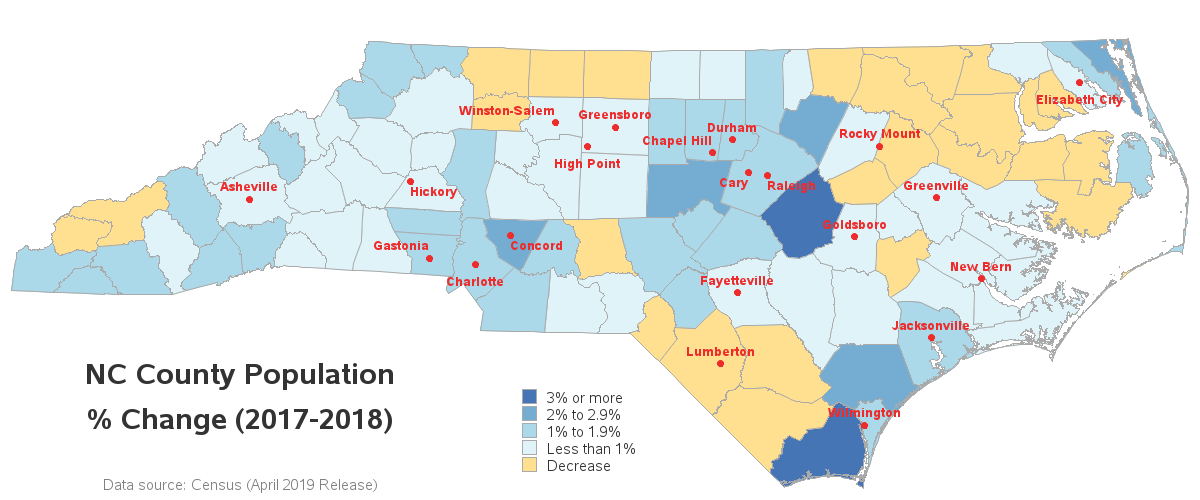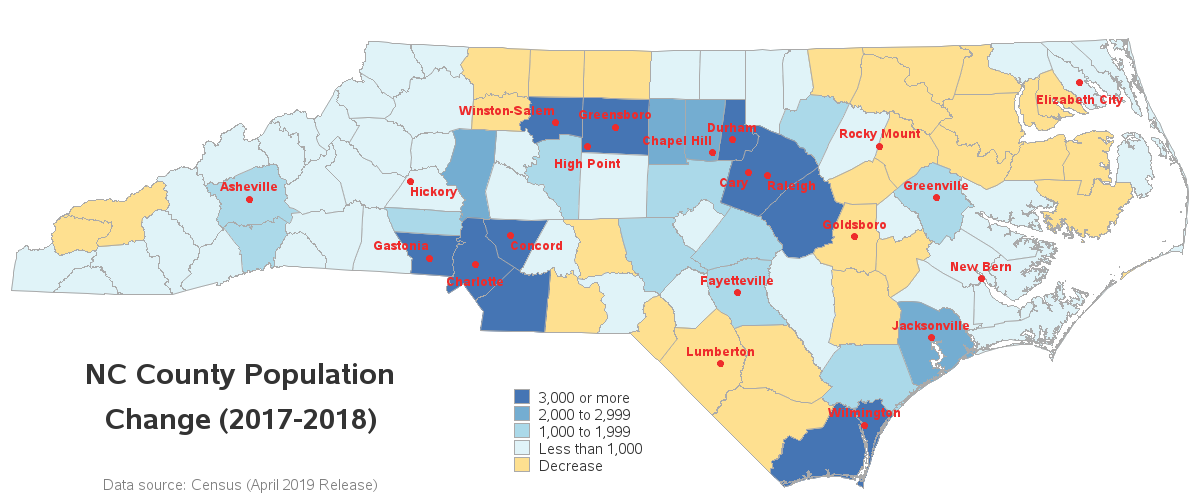
| NC County Population Change (2017-2018) |
| County | Population 2017 | Population 2018 | Change 2017 to 2018 | Change % |
|---|---|---|---|---|
| Alamance | 163,529 | 166,436 | 2,907 | 1.8% |
| Alexander | 37,146 | 37,353 | 207 | 0.6% |
| Alleghany | 11,023 | 11,161 | 138 | 1.3% |
| Anson | 24,878 | 24,877 | -1 | 0.0% |
| Ashe | 26,803 | 27,109 | 306 | 1.1% |
| Avery | 17,505 | 17,505 | 0 | 0.0% |
| Beaufort | 47,051 | 47,079 | 28 | 0.1% |
| Bertie | 19,274 | 19,026 | -248 | -1.3% |
| Bladen | 33,468 | 33,190 | -278 | -0.8% |
| Brunswick | 130,735 | 136,744 | 6,009 | 4.6% |
| Buncombe | 257,185 | 259,103 | 1,918 | 0.7% |
| Burke | 90,127 | 90,382 | 255 | 0.3% |
| Cabarrus | 206,724 | 211,342 | 4,618 | 2.2% |
| Caldwell | 81,920 | 82,029 | 109 | 0.1% |
| Camden | 10,561 | 10,710 | 149 | 1.4% |
| Carteret | 68,919 | 69,524 | 605 | 0.9% |
| Caswell | 22,632 | 22,698 | 66 | 0.3% |
| Catawba | 157,811 | 158,652 | 841 | 0.5% |
| Chatham | 71,248 | 73,139 | 1,891 | 2.7% |
| Cherokee | 27,980 | 28,383 | 403 | 1.4% |
| Chowan | 14,040 | 14,029 | -11 | -0.1% |
| Clay | 11,001 | 11,139 | 138 | 1.3% |
| Cleveland | 97,228 | 97,645 | 417 | 0.4% |
| Columbus | 55,987 | 55,655 | -332 | -0.6% |
| Craven | 102,754 | 102,912 | 158 | 0.2% |
| Cumberland | 331,239 | 332,330 | 1,091 | 0.3% |
| Currituck | 26,323 | 27,072 | 749 | 2.8% |
| Dare | 36,115 | 36,501 | 386 | 1.1% |
| Davidson | 165,313 | 166,614 | 1,301 | 0.8% |
| Davie | 42,369 | 42,733 | 364 | 0.9% |
| Duplin | 58,862 | 58,856 | -6 | 0.0% |
| Durham | 311,888 | 316,739 | 4,851 | 1.6% |
| Edgecombe | 52,757 | 52,005 | -752 | -1.4% |
| Forsyth | 375,724 | 379,099 | 3,375 | 0.9% |
| Franklin | 66,033 | 67,560 | 1,527 | 2.3% |
| Gaston | 219,819 | 222,846 | 3,027 | 1.4% |
| Gates | 11,515 | 11,573 | 58 | 0.5% |
| Graham | 8,534 | 8,484 | -50 | -0.6% |
| Granville | 59,374 | 60,115 | 741 | 1.2% |
| Greene | 20,980 | 21,012 | 32 | 0.2% |
| Guilford | 529,496 | 533,670 | 4,174 | 0.8% |
| Halifax | 51,282 | 50,574 | -708 | -1.4% |
| Harnett | 132,229 | 134,214 | 1,985 | 1.5% |
| Haywood | 61,036 | 61,971 | 935 | 1.5% |
| Henderson | 115,457 | 116,748 | 1,291 | 1.1% |
| Hertford | 23,926 | 23,659 | -267 | -1.1% |
| Hoke | 54,141 | 54,764 | 623 | 1.2% |
| Hyde | 5,267 | 5,230 | -37 | -0.7% |
| Iredell | 175,628 | 178,435 | 2,807 | 1.6% |
| Jackson | 43,192 | 43,327 | 135 | 0.3% |
| Johnston | 196,423 | 202,675 | 6,252 | 3.2% |
| Jones | 9,602 | 9,637 | 35 | 0.4% |
| Lee | 60,567 | 61,452 | 885 | 1.5% |
| Lenoir | 56,641 | 55,976 | -665 | -1.2% |
| Lincoln | 82,365 | 83,770 | 1,405 | 1.7% |
| Macon | 34,624 | 35,285 | 661 | 1.9% |
| Madison | 21,577 | 21,763 | 186 | 0.9% |
| Martin | 22,776 | 22,671 | -105 | -0.5% |
| McDowell | 45,164 | 45,507 | 343 | 0.8% |
| Mecklenburg | 1,077,311 | 1,093,901 | 16,590 | 1.5% |
| Mitchell | 14,979 | 15,000 | 21 | 0.1% |
| Montgomery | 27,347 | 27,271 | -76 | -0.3% |
| Moore | 97,232 | 98,682 | 1,450 | 1.5% |
| Nash | 94,012 | 94,016 | 4 | 0.0% |
| New Hanover | 228,657 | 232,274 | 3,617 | 1.6% |
| Northampton | 19,913 | 19,676 | -237 | -1.2% |
| Onslow | 194,838 | 197,683 | 2,845 | 1.5% |
| Orange | 143,960 | 146,027 | 2,067 | 1.4% |
| Pamlico | 12,654 | 12,670 | 16 | 0.1% |
| Pasquotank | 39,476 | 39,639 | 163 | 0.4% |
| Pender | 60,768 | 62,162 | 1,394 | 2.3% |
| Perquimans | 13,460 | 13,422 | -38 | -0.3% |
| Person | 39,395 | 39,507 | 112 | 0.3% |
| Pitt | 178,617 | 179,914 | 1,297 | 0.7% |
| Polk | 20,518 | 20,611 | 93 | 0.5% |
| Randolph | 143,149 | 143,351 | 202 | 0.1% |
| Richmond | 44,825 | 44,887 | 62 | 0.1% |
| Robeson | 132,590 | 131,831 | -759 | -0.6% |
| Rockingham | 90,841 | 90,690 | -151 | -0.2% |
| Rowan | 140,537 | 141,262 | 725 | 0.5% |
| Rutherford | 66,568 | 66,826 | 258 | 0.4% |
| Sampson | 63,433 | 63,626 | 193 | 0.3% |
| Scotland | 35,172 | 34,810 | -362 | -1.0% |
| Stanly | 61,451 | 62,075 | 624 | 1.0% |
| Stokes | 45,697 | 45,467 | -230 | -0.5% |
| Surry | 72,118 | 71,948 | -170 | -0.2% |
| Swain | 14,266 | 14,245 | -21 | -0.1% |
| Transylvania | 33,825 | 34,215 | 390 | 1.2% |
| Tyrrell | 4,183 | 4,131 | -52 | -1.2% |
| Union | 231,424 | 235,908 | 4,484 | 1.9% |
| Vance | 44,312 | 44,582 | 270 | 0.6% |
| Wake | 1,071,886 | 1,092,305 | 20,419 | 1.9% |
| Warren | 19,869 | 19,807 | -62 | -0.3% |
| Washington | 12,019 | 11,859 | -160 | -1.3% |
| Watauga | 55,088 | 55,945 | 857 | 1.6% |
| Wayne | 123,257 | 123,248 | -9 | 0.0% |
| Wilkes | 68,464 | 68,557 | 93 | 0.1% |
| Wilson | 81,567 | 81,455 | -112 | -0.1% |
| Yadkin | 37,643 | 37,543 | -100 | -0.3% |
| Yancey | 17,712 | 17,903 | 191 | 1.1% |