County = Scotland County
Cases reported = 1,760
Population = 34,810
% of population reported positive = 5.1% County = Robeson County
Cases reported = 6,702
Population = 131,831
% of population reported positive = 5.1% County = Greene County
Cases reported = 1,097
Population = 21,012
% of population reported positive = 5.2% County = Duplin County
Cases reported = 3,053
Population = 58,856
% of population reported positive = 5.2% County = Wilson County
Cases reported = 3,554
Population = 81,455
% of population reported positive = 4.4% County = Wayne County
Cases reported = 5,165
Population = 123,248
% of population reported positive = 4.2% County = Stanly County
Cases reported = 2,682
Population = 62,075
% of population reported positive = 4.3% County = Sampson County
Cases reported = 3,206
Population = 63,626
% of population reported positive = 5.0% County = Nash County
Cases reported = 3,962
Population = 94,016
% of population reported positive = 4.2% County = Montgomery County
Cases reported = 1,282
Population = 27,271
% of population reported positive = 4.7% County = Edgecombe County
Cases reported = 2,291
Population = 52,005
% of population reported positive = 4.4% County = Chowan County
Cases reported = 572
Population = 14,029
% of population reported positive = 4.1% County = Chowan County
Cases reported = 572
Population = 14,029
% of population reported positive = 4.1% County = Bertie County
Cases reported = 795
Population = 19,026
% of population reported positive = 4.2% County = Bertie County
Cases reported = 795
Population = 19,026
% of population reported positive = 4.2% County = Avery County
Cases reported = 724
Population = 17,505
% of population reported positive = 4.1% County = Yadkin County
Cases reported = 1,250
Population = 37,543
% of population reported positive = 3.3% County = Wilkes County
Cases reported = 2,250
Population = 68,557
% of population reported positive = 3.3% County = Vance County
Cases reported = 1,444
Population = 44,582
% of population reported positive = 3.2% County = Tyrrell County
Cases reported = 135
Population = 4,131
% of population reported positive = 3.3% County = Tyrrell County
Cases reported = 135
Population = 4,131
% of population reported positive = 3.3% County = Surry County
Cases reported = 2,351
Population = 71,948
% of population reported positive = 3.3% County = Rowan County
Cases reported = 4,870
Population = 141,262
% of population reported positive = 3.4% County = Richmond County
Cases reported = 1,640
Population = 44,887
% of population reported positive = 3.7% County = Randolph County
Cases reported = 4,626
Population = 143,351
% of population reported positive = 3.2% County = Pitt County
Cases reported = 7,015
Population = 179,914
% of population reported positive = 3.9% County = Northampton County
Cases reported = 671
Population = 19,676
% of population reported positive = 3.4% County = Mecklenburg County
Cases reported = 38,295
Population = 1,093,901
% of population reported positive = 3.5% County = Martin County
Cases reported = 732
Population = 22,671
% of population reported positive = 3.2% County = McDowell County
Cases reported = 1,571
Population = 45,507
% of population reported positive = 3.5% County = Lincoln County
Cases reported = 2,916
Population = 83,770
% of population reported positive = 3.5% County = Lenoir County
Cases reported = 1,767
Population = 55,976
% of population reported positive = 3.2% County = Lee County
Cases reported = 2,281
Population = 61,452
% of population reported positive = 3.7% County = Johnston County
Cases reported = 6,610
Population = 202,675
% of population reported positive = 3.3% County = Hyde County
Cases reported = 179
Population = 5,230
% of population reported positive = 3.4% County = Hyde County
Cases reported = 179
Population = 5,230
% of population reported positive = 3.4% County = Hyde County
Cases reported = 179
Population = 5,230
% of population reported positive = 3.4% County = Hyde County
Cases reported = 179
Population = 5,230
% of population reported positive = 3.4% County = Hyde County
Cases reported = 179
Population = 5,230
% of population reported positive = 3.4% County = Hyde County
Cases reported = 179
Population = 5,230
% of population reported positive = 3.4% County = Hyde County
Cases reported = 179
Population = 5,230
% of population reported positive = 3.4% County = Hyde County
Cases reported = 179
Population = 5,230
% of population reported positive = 3.4% County = Hyde County
Cases reported = 179
Population = 5,230
% of population reported positive = 3.4% County = Hoke County
Cases reported = 1,759
Population = 54,764
% of population reported positive = 3.2% County = Hertford County
Cases reported = 912
Population = 23,659
% of population reported positive = 3.9% County = Halifax County
Cases reported = 1,714
Population = 50,574
% of population reported positive = 3.4% County = Granville County
Cases reported = 2,283
Population = 60,115
% of population reported positive = 3.8% County = Graham County
Cases reported = 265
Population = 8,484
% of population reported positive = 3.1% County = Gaston County
Cases reported = 8,874
Population = 222,846
% of population reported positive = 4.0% County = Durham County
Cases reported = 10,250
Population = 316,739
% of population reported positive = 3.2% County = Columbus County
Cases reported = 2,183
Population = 55,655
% of population reported positive = 3.9% County = Cleveland County
Cases reported = 3,765
Population = 97,645
% of population reported positive = 3.9% County = Catawba County
Cases reported = 5,613
Population = 158,652
% of population reported positive = 3.5% County = Caswell County
Cases reported = 723
Population = 22,698
% of population reported positive = 3.2% County = Caldwell County
Cases reported = 3,036
Population = 82,029
% of population reported positive = 3.7% County = Burke County
Cases reported = 3,214
Population = 90,382
% of population reported positive = 3.6% County = Bladen County
Cases reported = 1,187
Population = 33,190
% of population reported positive = 3.6% County = Beaufort County
Cases reported = 1,544
Population = 47,079
% of population reported positive = 3.3% County = Beaufort County
Cases reported = 1,544
Population = 47,079
% of population reported positive = 3.3% County = Beaufort County
Cases reported = 1,544
Population = 47,079
% of population reported positive = 3.3% County = Anson County
Cases reported = 815
Population = 24,877
% of population reported positive = 3.3% County = Alleghany County
Cases reported = 359
Population = 11,161
% of population reported positive = 3.2% County = Alexander County
Cases reported = 1,280
Population = 37,353
% of population reported positive = 3.4% County = Alamance County
Cases reported = 6,069
Population = 166,436
% of population reported positive = 3.6% County = Yancey County
Cases reported = 421
Population = 17,903
% of population reported positive = 2.4% County = Watauga County
Cases reported = 1,580
Population = 55,945
% of population reported positive = 2.8% County = Washington County
Cases reported = 285
Population = 11,859
% of population reported positive = 2.4% County = Warren County
Cases reported = 549
Population = 19,807
% of population reported positive = 2.8% County = Wake County
Cases reported = 24,703
Population = 1,092,305
% of population reported positive = 2.3% County = Union County
Cases reported = 6,818
Population = 235,908
% of population reported positive = 2.9% County = Swain County
Cases reported = 335
Population = 14,245
% of population reported positive = 2.4% County = Rutherford County
Cases reported = 1,982
Population = 66,826
% of population reported positive = 3.0% County = Rockingham County
Cases reported = 2,556
Population = 90,690
% of population reported positive = 2.8% County = Polk County
Cases reported = 430
Population = 20,611
% of population reported positive = 2.1% County = Person County
Cases reported = 828
Population = 39,507
% of population reported positive = 2.1% County = Perquimans County
Cases reported = 288
Population = 13,422
% of population reported positive = 2.1% County = Pender County
Cases reported = 1,616
Population = 62,162
% of population reported positive = 2.6% County = Pender County
Cases reported = 1,616
Population = 62,162
% of population reported positive = 2.6% County = Pender County
Cases reported = 1,616
Population = 62,162
% of population reported positive = 2.6% County = Pender County
Cases reported = 1,616
Population = 62,162
% of population reported positive = 2.6% County = Pender County
Cases reported = 1,616
Population = 62,162
% of population reported positive = 2.6% County = Pender County
Cases reported = 1,616
Population = 62,162
% of population reported positive = 2.6% County = Pender County
Cases reported = 1,616
Population = 62,162
% of population reported positive = 2.6% County = Pender County
Cases reported = 1,616
Population = 62,162
% of population reported positive = 2.6% County = Pender County
Cases reported = 1,616
Population = 62,162
% of population reported positive = 2.6% County = Pender County
Cases reported = 1,616
Population = 62,162
% of population reported positive = 2.6% County = Pender County
Cases reported = 1,616
Population = 62,162
% of population reported positive = 2.6% County = Pender County
Cases reported = 1,616
Population = 62,162
% of population reported positive = 2.6% County = Pender County
Cases reported = 1,616
Population = 62,162
% of population reported positive = 2.6% County = Pender County
Cases reported = 1,616
Population = 62,162
% of population reported positive = 2.6% County = Pender County
Cases reported = 1,616
Population = 62,162
% of population reported positive = 2.6% County = Pender County
Cases reported = 1,616
Population = 62,162
% of population reported positive = 2.6% County = Pender County
Cases reported = 1,616
Population = 62,162
% of population reported positive = 2.6% County = Pender County
Cases reported = 1,616
Population = 62,162
% of population reported positive = 2.6% County = Pender County
Cases reported = 1,616
Population = 62,162
% of population reported positive = 2.6% County = Pender County
Cases reported = 1,616
Population = 62,162
% of population reported positive = 2.6% County = Pender County
Cases reported = 1,616
Population = 62,162
% of population reported positive = 2.6% County = Pender County
Cases reported = 1,616
Population = 62,162
% of population reported positive = 2.6% County = Pender County
Cases reported = 1,616
Population = 62,162
% of population reported positive = 2.6% County = Pasquotank County
Cases reported = 990
Population = 39,639
% of population reported positive = 2.5% County = Pamlico County
Cases reported = 357
Population = 12,670
% of population reported positive = 2.8% County = Orange County
Cases reported = 3,502
Population = 146,027
% of population reported positive = 2.4% County = Onslow County
Cases reported = 4,176
Population = 197,683
% of population reported positive = 2.1% County = Onslow County
Cases reported = 4,176
Population = 197,683
% of population reported positive = 2.1% County = Onslow County
Cases reported = 4,176
Population = 197,683
% of population reported positive = 2.1% County = Onslow County
Cases reported = 4,176
Population = 197,683
% of population reported positive = 2.1% County = Onslow County
Cases reported = 4,176
Population = 197,683
% of population reported positive = 2.1% County = Onslow County
Cases reported = 4,176
Population = 197,683
% of population reported positive = 2.1% County = Onslow County
Cases reported = 4,176
Population = 197,683
% of population reported positive = 2.1% County = Onslow County
Cases reported = 4,176
Population = 197,683
% of population reported positive = 2.1% County = Onslow County
Cases reported = 4,176
Population = 197,683
% of population reported positive = 2.1% County = Onslow County
Cases reported = 4,176
Population = 197,683
% of population reported positive = 2.1% County = Onslow County
Cases reported = 4,176
Population = 197,683
% of population reported positive = 2.1% County = Onslow County
Cases reported = 4,176
Population = 197,683
% of population reported positive = 2.1% County = Onslow County
Cases reported = 4,176
Population = 197,683
% of population reported positive = 2.1% County = Onslow County
Cases reported = 4,176
Population = 197,683
% of population reported positive = 2.1% County = Onslow County
Cases reported = 4,176
Population = 197,683
% of population reported positive = 2.1% County = Onslow County
Cases reported = 4,176
Population = 197,683
% of population reported positive = 2.1% County = Onslow County
Cases reported = 4,176
Population = 197,683
% of population reported positive = 2.1% County = Onslow County
Cases reported = 4,176
Population = 197,683
% of population reported positive = 2.1% County = New Hanover County
Cases reported = 6,134
Population = 232,274
% of population reported positive = 2.6% County = New Hanover County
Cases reported = 6,134
Population = 232,274
% of population reported positive = 2.6% County = New Hanover County
Cases reported = 6,134
Population = 232,274
% of population reported positive = 2.6% County = New Hanover County
Cases reported = 6,134
Population = 232,274
% of population reported positive = 2.6% County = New Hanover County
Cases reported = 6,134
Population = 232,274
% of population reported positive = 2.6% County = New Hanover County
Cases reported = 6,134
Population = 232,274
% of population reported positive = 2.6% County = New Hanover County
Cases reported = 6,134
Population = 232,274
% of population reported positive = 2.6% County = New Hanover County
Cases reported = 6,134
Population = 232,274
% of population reported positive = 2.6% County = New Hanover County
Cases reported = 6,134
Population = 232,274
% of population reported positive = 2.6% County = New Hanover County
Cases reported = 6,134
Population = 232,274
% of population reported positive = 2.6% County = New Hanover County
Cases reported = 6,134
Population = 232,274
% of population reported positive = 2.6% County = New Hanover County
Cases reported = 6,134
Population = 232,274
% of population reported positive = 2.6% County = New Hanover County
Cases reported = 6,134
Population = 232,274
% of population reported positive = 2.6% County = New Hanover County
Cases reported = 6,134
Population = 232,274
% of population reported positive = 2.6% County = New Hanover County
Cases reported = 6,134
Population = 232,274
% of population reported positive = 2.6% County = New Hanover County
Cases reported = 6,134
Population = 232,274
% of population reported positive = 2.6% County = New Hanover County
Cases reported = 6,134
Population = 232,274
% of population reported positive = 2.6% County = New Hanover County
Cases reported = 6,134
Population = 232,274
% of population reported positive = 2.6% County = New Hanover County
Cases reported = 6,134
Population = 232,274
% of population reported positive = 2.6% County = New Hanover County
Cases reported = 6,134
Population = 232,274
% of population reported positive = 2.6% County = Moore County
Cases reported = 2,556
Population = 98,682
% of population reported positive = 2.6% County = Mitchell County
Cases reported = 402
Population = 15,000
% of population reported positive = 2.7% County = Macon County
Cases reported = 846
Population = 35,285
% of population reported positive = 2.4% County = Jones County
Cases reported = 219
Population = 9,637
% of population reported positive = 2.3% County = Jackson County
Cases reported = 1,277
Population = 43,327
% of population reported positive = 2.9% County = Iredell County
Cases reported = 4,550
Population = 178,435
% of population reported positive = 2.5% County = Henderson County
Cases reported = 2,796
Population = 116,748
% of population reported positive = 2.4% County = Harnett County
Cases reported = 3,414
Population = 134,214
% of population reported positive = 2.5% County = Guilford County
Cases reported = 14,022
Population = 533,670
% of population reported positive = 2.6% County = Franklin County
Cases reported = 1,713
Population = 67,560
% of population reported positive = 2.5% County = Forsyth County
Cases reported = 10,938
Population = 379,099
% of population reported positive = 2.9% County = Davie County
Cases reported = 970
Population = 42,733
% of population reported positive = 2.3% County = Davidson County
Cases reported = 4,423
Population = 166,614
% of population reported positive = 2.7% County = Cumberland County
Cases reported = 8,214
Population = 332,330
% of population reported positive = 2.5% County = Craven County
Cases reported = 2,693
Population = 102,912
% of population reported positive = 2.6% County = Craven County
Cases reported = 2,693
Population = 102,912
% of population reported positive = 2.6% County = Craven County
Cases reported = 2,693
Population = 102,912
% of population reported positive = 2.6% County = Clay County
Cases reported = 265
Population = 11,139
% of population reported positive = 2.4% County = Cherokee County
Cases reported = 854
Population = 28,383
% of population reported positive = 3.0% County = Chatham County
Cases reported = 2,171
Population = 73,139
% of population reported positive = 3.0% County = Carteret County
Cases reported = 1,435
Population = 69,524
% of population reported positive = 2.1% County = Carteret County
Cases reported = 1,435
Population = 69,524
% of population reported positive = 2.1% County = Carteret County
Cases reported = 1,435
Population = 69,524
% of population reported positive = 2.1% County = Carteret County
Cases reported = 1,435
Population = 69,524
% of population reported positive = 2.1% County = Carteret County
Cases reported = 1,435
Population = 69,524
% of population reported positive = 2.1% County = Carteret County
Cases reported = 1,435
Population = 69,524
% of population reported positive = 2.1% County = Carteret County
Cases reported = 1,435
Population = 69,524
% of population reported positive = 2.1% County = Carteret County
Cases reported = 1,435
Population = 69,524
% of population reported positive = 2.1% County = Carteret County
Cases reported = 1,435
Population = 69,524
% of population reported positive = 2.1% County = Carteret County
Cases reported = 1,435
Population = 69,524
% of population reported positive = 2.1% County = Carteret County
Cases reported = 1,435
Population = 69,524
% of population reported positive = 2.1% County = Carteret County
Cases reported = 1,435
Population = 69,524
% of population reported positive = 2.1% County = Carteret County
Cases reported = 1,435
Population = 69,524
% of population reported positive = 2.1% County = Carteret County
Cases reported = 1,435
Population = 69,524
% of population reported positive = 2.1% County = Carteret County
Cases reported = 1,435
Population = 69,524
% of population reported positive = 2.1% County = Carteret County
Cases reported = 1,435
Population = 69,524
% of population reported positive = 2.1% County = Carteret County
Cases reported = 1,435
Population = 69,524
% of population reported positive = 2.1% County = Carteret County
Cases reported = 1,435
Population = 69,524
% of population reported positive = 2.1% County = Carteret County
Cases reported = 1,435
Population = 69,524
% of population reported positive = 2.1% County = Carteret County
Cases reported = 1,435
Population = 69,524
% of population reported positive = 2.1% County = Carteret County
Cases reported = 1,435
Population = 69,524
% of population reported positive = 2.1% County = Carteret County
Cases reported = 1,435
Population = 69,524
% of population reported positive = 2.1% County = Carteret County
Cases reported = 1,435
Population = 69,524
% of population reported positive = 2.1% County = Carteret County
Cases reported = 1,435
Population = 69,524
% of population reported positive = 2.1% County = Carteret County
Cases reported = 1,435
Population = 69,524
% of population reported positive = 2.1% County = Carteret County
Cases reported = 1,435
Population = 69,524
% of population reported positive = 2.1% County = Carteret County
Cases reported = 1,435
Population = 69,524
% of population reported positive = 2.1% County = Carteret County
Cases reported = 1,435
Population = 69,524
% of population reported positive = 2.1% County = Carteret County
Cases reported = 1,435
Population = 69,524
% of population reported positive = 2.1% County = Carteret County
Cases reported = 1,435
Population = 69,524
% of population reported positive = 2.1% County = Carteret County
Cases reported = 1,435
Population = 69,524
% of population reported positive = 2.1% County = Carteret County
Cases reported = 1,435
Population = 69,524
% of population reported positive = 2.1% County = Carteret County
Cases reported = 1,435
Population = 69,524
% of population reported positive = 2.1% County = Carteret County
Cases reported = 1,435
Population = 69,524
% of population reported positive = 2.1% County = Carteret County
Cases reported = 1,435
Population = 69,524
% of population reported positive = 2.1% County = Carteret County
Cases reported = 1,435
Population = 69,524
% of population reported positive = 2.1% County = Carteret County
Cases reported = 1,435
Population = 69,524
% of population reported positive = 2.1% County = Carteret County
Cases reported = 1,435
Population = 69,524
% of population reported positive = 2.1% County = Carteret County
Cases reported = 1,435
Population = 69,524
% of population reported positive = 2.1% County = Carteret County
Cases reported = 1,435
Population = 69,524
% of population reported positive = 2.1% County = Carteret County
Cases reported = 1,435
Population = 69,524
% of population reported positive = 2.1% County = Carteret County
Cases reported = 1,435
Population = 69,524
% of population reported positive = 2.1% County = Carteret County
Cases reported = 1,435
Population = 69,524
% of population reported positive = 2.1% County = Carteret County
Cases reported = 1,435
Population = 69,524
% of population reported positive = 2.1% County = Carteret County
Cases reported = 1,435
Population = 69,524
% of population reported positive = 2.1% County = Carteret County
Cases reported = 1,435
Population = 69,524
% of population reported positive = 2.1% County = Carteret County
Cases reported = 1,435
Population = 69,524
% of population reported positive = 2.1% County = Carteret County
Cases reported = 1,435
Population = 69,524
% of population reported positive = 2.1% County = Carteret County
Cases reported = 1,435
Population = 69,524
% of population reported positive = 2.1% County = Carteret County
Cases reported = 1,435
Population = 69,524
% of population reported positive = 2.1% County = Carteret County
Cases reported = 1,435
Population = 69,524
% of population reported positive = 2.1% County = Carteret County
Cases reported = 1,435
Population = 69,524
% of population reported positive = 2.1% County = Carteret County
Cases reported = 1,435
Population = 69,524
% of population reported positive = 2.1% County = Carteret County
Cases reported = 1,435
Population = 69,524
% of population reported positive = 2.1% County = Carteret County
Cases reported = 1,435
Population = 69,524
% of population reported positive = 2.1% County = Carteret County
Cases reported = 1,435
Population = 69,524
% of population reported positive = 2.1% County = Carteret County
Cases reported = 1,435
Population = 69,524
% of population reported positive = 2.1% County = Carteret County
Cases reported = 1,435
Population = 69,524
% of population reported positive = 2.1% County = Carteret County
Cases reported = 1,435
Population = 69,524
% of population reported positive = 2.1% County = Carteret County
Cases reported = 1,435
Population = 69,524
% of population reported positive = 2.1% County = Carteret County
Cases reported = 1,435
Population = 69,524
% of population reported positive = 2.1% County = Carteret County
Cases reported = 1,435
Population = 69,524
% of population reported positive = 2.1% County = Carteret County
Cases reported = 1,435
Population = 69,524
% of population reported positive = 2.1% County = Carteret County
Cases reported = 1,435
Population = 69,524
% of population reported positive = 2.1% County = Carteret County
Cases reported = 1,435
Population = 69,524
% of population reported positive = 2.1% County = Carteret County
Cases reported = 1,435
Population = 69,524
% of population reported positive = 2.1% County = Carteret County
Cases reported = 1,435
Population = 69,524
% of population reported positive = 2.1% County = Carteret County
Cases reported = 1,435
Population = 69,524
% of population reported positive = 2.1% County = Carteret County
Cases reported = 1,435
Population = 69,524
% of population reported positive = 2.1% County = Carteret County
Cases reported = 1,435
Population = 69,524
% of population reported positive = 2.1% County = Carteret County
Cases reported = 1,435
Population = 69,524
% of population reported positive = 2.1% County = Carteret County
Cases reported = 1,435
Population = 69,524
% of population reported positive = 2.1% County = Carteret County
Cases reported = 1,435
Population = 69,524
% of population reported positive = 2.1% County = Carteret County
Cases reported = 1,435
Population = 69,524
% of population reported positive = 2.1% County = Carteret County
Cases reported = 1,435
Population = 69,524
% of population reported positive = 2.1% County = Carteret County
Cases reported = 1,435
Population = 69,524
% of population reported positive = 2.1% County = Cabarrus County
Cases reported = 5,864
Population = 211,342
% of population reported positive = 2.8% County = Ashe County
Cases reported = 629
Population = 27,109
% of population reported positive = 2.3% County = Transylvania County
Cases reported = 485
Population = 34,215
% of population reported positive = 1.4% County = Stokes County
Cases reported = 905
Population = 45,467
% of population reported positive = 2.0% County = Madison County
Cases reported = 390
Population = 21,763
% of population reported positive = 1.8% County = Haywood County
Cases reported = 865
Population = 61,971
% of population reported positive = 1.4% County = Gates County
Cases reported = 184
Population = 11,573
% of population reported positive = 1.6% County = Dare County
Cases reported = 523
Population = 36,501
% of population reported positive = 1.4% County = Dare County
Cases reported = 523
Population = 36,501
% of population reported positive = 1.4% County = Dare County
Cases reported = 523
Population = 36,501
% of population reported positive = 1.4% County = Dare County
Cases reported = 523
Population = 36,501
% of population reported positive = 1.4% County = Dare County
Cases reported = 523
Population = 36,501
% of population reported positive = 1.4% County = Dare County
Cases reported = 523
Population = 36,501
% of population reported positive = 1.4% County = Dare County
Cases reported = 523
Population = 36,501
% of population reported positive = 1.4% County = Dare County
Cases reported = 523
Population = 36,501
% of population reported positive = 1.4% County = Dare County
Cases reported = 523
Population = 36,501
% of population reported positive = 1.4% County = Dare County
Cases reported = 523
Population = 36,501
% of population reported positive = 1.4% County = Dare County
Cases reported = 523
Population = 36,501
% of population reported positive = 1.4% County = Dare County
Cases reported = 523
Population = 36,501
% of population reported positive = 1.4% County = Dare County
Cases reported = 523
Population = 36,501
% of population reported positive = 1.4% County = Dare County
Cases reported = 523
Population = 36,501
% of population reported positive = 1.4% County = Dare County
Cases reported = 523
Population = 36,501
% of population reported positive = 1.4% County = Dare County
Cases reported = 523
Population = 36,501
% of population reported positive = 1.4% County = Dare County
Cases reported = 523
Population = 36,501
% of population reported positive = 1.4% County = Dare County
Cases reported = 523
Population = 36,501
% of population reported positive = 1.4% County = Dare County
Cases reported = 523
Population = 36,501
% of population reported positive = 1.4% County = Dare County
Cases reported = 523
Population = 36,501
% of population reported positive = 1.4% County = Dare County
Cases reported = 523
Population = 36,501
% of population reported positive = 1.4% County = Dare County
Cases reported = 523
Population = 36,501
% of population reported positive = 1.4% County = Dare County
Cases reported = 523
Population = 36,501
% of population reported positive = 1.4% County = Dare County
Cases reported = 523
Population = 36,501
% of population reported positive = 1.4% County = Dare County
Cases reported = 523
Population = 36,501
% of population reported positive = 1.4% County = Dare County
Cases reported = 523
Population = 36,501
% of population reported positive = 1.4% County = Dare County
Cases reported = 523
Population = 36,501
% of population reported positive = 1.4% County = Dare County
Cases reported = 523
Population = 36,501
% of population reported positive = 1.4% County = Dare County
Cases reported = 523
Population = 36,501
% of population reported positive = 1.4% County = Dare County
Cases reported = 523
Population = 36,501
% of population reported positive = 1.4% County = Dare County
Cases reported = 523
Population = 36,501
% of population reported positive = 1.4% County = Dare County
Cases reported = 523
Population = 36,501
% of population reported positive = 1.4% County = Dare County
Cases reported = 523
Population = 36,501
% of population reported positive = 1.4% County = Dare County
Cases reported = 523
Population = 36,501
% of population reported positive = 1.4% County = Dare County
Cases reported = 523
Population = 36,501
% of population reported positive = 1.4% County = Dare County
Cases reported = 523
Population = 36,501
% of population reported positive = 1.4% County = Dare County
Cases reported = 523
Population = 36,501
% of population reported positive = 1.4% County = Dare County
Cases reported = 523
Population = 36,501
% of population reported positive = 1.4% County = Dare County
Cases reported = 523
Population = 36,501
% of population reported positive = 1.4% County = Dare County
Cases reported = 523
Population = 36,501
% of population reported positive = 1.4% County = Dare County
Cases reported = 523
Population = 36,501
% of population reported positive = 1.4% County = Dare County
Cases reported = 523
Population = 36,501
% of population reported positive = 1.4% County = Dare County
Cases reported = 523
Population = 36,501
% of population reported positive = 1.4% County = Currituck County
Cases reported = 276
Population = 27,072
% of population reported positive = 1.0% County = Currituck County
Cases reported = 276
Population = 27,072
% of population reported positive = 1.0% County = Currituck County
Cases reported = 276
Population = 27,072
% of population reported positive = 1.0% County = Currituck County
Cases reported = 276
Population = 27,072
% of population reported positive = 1.0% County = Currituck County
Cases reported = 276
Population = 27,072
% of population reported positive = 1.0% County = Currituck County
Cases reported = 276
Population = 27,072
% of population reported positive = 1.0% County = Currituck County
Cases reported = 276
Population = 27,072
% of population reported positive = 1.0% County = Currituck County
Cases reported = 276
Population = 27,072
% of population reported positive = 1.0% County = Currituck County
Cases reported = 276
Population = 27,072
% of population reported positive = 1.0% County = Currituck County
Cases reported = 276
Population = 27,072
% of population reported positive = 1.0% County = Currituck County
Cases reported = 276
Population = 27,072
% of population reported positive = 1.0% County = Currituck County
Cases reported = 276
Population = 27,072
% of population reported positive = 1.0% County = Currituck County
Cases reported = 276
Population = 27,072
% of population reported positive = 1.0% County = Currituck County
Cases reported = 276
Population = 27,072
% of population reported positive = 1.0% County = Currituck County
Cases reported = 276
Population = 27,072
% of population reported positive = 1.0% County = Currituck County
Cases reported = 276
Population = 27,072
% of population reported positive = 1.0% County = Currituck County
Cases reported = 276
Population = 27,072
% of population reported positive = 1.0% County = Currituck County
Cases reported = 276
Population = 27,072
% of population reported positive = 1.0% County = Currituck County
Cases reported = 276
Population = 27,072
% of population reported positive = 1.0% County = Currituck County
Cases reported = 276
Population = 27,072
% of population reported positive = 1.0% County = Currituck County
Cases reported = 276
Population = 27,072
% of population reported positive = 1.0% County = Currituck County
Cases reported = 276
Population = 27,072
% of population reported positive = 1.0% County = Currituck County
Cases reported = 276
Population = 27,072
% of population reported positive = 1.0% County = Currituck County
Cases reported = 276
Population = 27,072
% of population reported positive = 1.0% County = Currituck County
Cases reported = 276
Population = 27,072
% of population reported positive = 1.0% County = Currituck County
Cases reported = 276
Population = 27,072
% of population reported positive = 1.0% County = Currituck County
Cases reported = 276
Population = 27,072
% of population reported positive = 1.0% County = Currituck County
Cases reported = 276
Population = 27,072
% of population reported positive = 1.0% County = Currituck County
Cases reported = 276
Population = 27,072
% of population reported positive = 1.0% County = Currituck County
Cases reported = 276
Population = 27,072
% of population reported positive = 1.0% County = Currituck County
Cases reported = 276
Population = 27,072
% of population reported positive = 1.0% County = Currituck County
Cases reported = 276
Population = 27,072
% of population reported positive = 1.0% County = Currituck County
Cases reported = 276
Population = 27,072
% of population reported positive = 1.0% County = Currituck County
Cases reported = 276
Population = 27,072
% of population reported positive = 1.0% County = Currituck County
Cases reported = 276
Population = 27,072
% of population reported positive = 1.0% County = Currituck County
Cases reported = 276
Population = 27,072
% of population reported positive = 1.0% County = Currituck County
Cases reported = 276
Population = 27,072
% of population reported positive = 1.0% County = Currituck County
Cases reported = 276
Population = 27,072
% of population reported positive = 1.0% County = Currituck County
Cases reported = 276
Population = 27,072
% of population reported positive = 1.0% County = Currituck County
Cases reported = 276
Population = 27,072
% of population reported positive = 1.0% County = Currituck County
Cases reported = 276
Population = 27,072
% of population reported positive = 1.0% County = Currituck County
Cases reported = 276
Population = 27,072
% of population reported positive = 1.0% County = Currituck County
Cases reported = 276
Population = 27,072
% of population reported positive = 1.0% County = Currituck County
Cases reported = 276
Population = 27,072
% of population reported positive = 1.0% County = Currituck County
Cases reported = 276
Population = 27,072
% of population reported positive = 1.0% County = Currituck County
Cases reported = 276
Population = 27,072
% of population reported positive = 1.0% County = Currituck County
Cases reported = 276
Population = 27,072
% of population reported positive = 1.0% County = Currituck County
Cases reported = 276
Population = 27,072
% of population reported positive = 1.0% County = Currituck County
Cases reported = 276
Population = 27,072
% of population reported positive = 1.0% County = Currituck County
Cases reported = 276
Population = 27,072
% of population reported positive = 1.0% County = Currituck County
Cases reported = 276
Population = 27,072
% of population reported positive = 1.0% County = Currituck County
Cases reported = 276
Population = 27,072
% of population reported positive = 1.0% County = Currituck County
Cases reported = 276
Population = 27,072
% of population reported positive = 1.0% County = Currituck County
Cases reported = 276
Population = 27,072
% of population reported positive = 1.0% County = Currituck County
Cases reported = 276
Population = 27,072
% of population reported positive = 1.0% County = Currituck County
Cases reported = 276
Population = 27,072
% of population reported positive = 1.0% County = Currituck County
Cases reported = 276
Population = 27,072
% of population reported positive = 1.0% County = Currituck County
Cases reported = 276
Population = 27,072
% of population reported positive = 1.0% County = Camden County
Cases reported = 158
Population = 10,710
% of population reported positive = 1.5% County = Buncombe County
Cases reported = 4,800
Population = 259,103
% of population reported positive = 1.9% County = Brunswick County
Cases reported = 2,554
Population = 136,744
% of population reported positive = 1.9% County = Brunswick County
Cases reported = 2,554
Population = 136,744
% of population reported positive = 1.9% County = Brunswick County
Cases reported = 2,554
Population = 136,744
% of population reported positive = 1.9% County = Brunswick County
Cases reported = 2,554
Population = 136,744
% of population reported positive = 1.9% County = Brunswick County
Cases reported = 2,554
Population = 136,744
% of population reported positive = 1.9% County = Brunswick County
Cases reported = 2,554
Population = 136,744
% of population reported positive = 1.9% County = Brunswick County
Cases reported = 2,554
Population = 136,744
% of population reported positive = 1.9% County = Brunswick County
Cases reported = 2,554
Population = 136,744
% of population reported positive = 1.9% County = Brunswick County
Cases reported = 2,554
Population = 136,744
% of population reported positive = 1.9% County = Brunswick County
Cases reported = 2,554
Population = 136,744
% of population reported positive = 1.9% County = Brunswick County
Cases reported = 2,554
Population = 136,744
% of population reported positive = 1.9% County = Brunswick County
Cases reported = 2,554
Population = 136,744
% of population reported positive = 1.9% County = Brunswick County
Cases reported = 2,554
Population = 136,744
% of population reported positive = 1.9% County = Brunswick County
Cases reported = 2,554
Population = 136,744
% of population reported positive = 1.9% County = Brunswick County
Cases reported = 2,554
Population = 136,744
% of population reported positive = 1.9% County = Brunswick County
Cases reported = 2,554
Population = 136,744
% of population reported positive = 1.9% County = Brunswick County
Cases reported = 2,554
Population = 136,744
% of population reported positive = 1.9% County = Brunswick County
Cases reported = 2,554
Population = 136,744
% of population reported positive = 1.9% County = Brunswick County
Cases reported = 2,554
Population = 136,744
% of population reported positive = 1.9% County = Brunswick County
Cases reported = 2,554
Population = 136,744
% of population reported positive = 1.9% County = Brunswick County
Cases reported = 2,554
Population = 136,744
% of population reported positive = 1.9% County = Brunswick County
Cases reported = 2,554
Population = 136,744
% of population reported positive = 1.9% County = Brunswick County
Cases reported = 2,554
Population = 136,744
% of population reported positive = 1.9% County = Brunswick County
Cases reported = 2,554
Population = 136,744
% of population reported positive = 1.9% County = Brunswick County
Cases reported = 2,554
Population = 136,744
% of population reported positive = 1.9% County = Brunswick County
Cases reported = 2,554
Population = 136,744
% of population reported positive = 1.9% County = Brunswick County
Cases reported = 2,554
Population = 136,744
% of population reported positive = 1.9% County = Brunswick County
Cases reported = 2,554
Population = 136,744
% of population reported positive = 1.9% County = Brunswick County
Cases reported = 2,554
Population = 136,744
% of population reported positive = 1.9% County = Brunswick County
Cases reported = 2,554
Population = 136,744
% of population reported positive = 1.9% County = Brunswick County
Cases reported = 2,554
Population = 136,744
% of population reported positive = 1.9% County = Brunswick County
Cases reported = 2,554
Population = 136,744
% of population reported positive = 1.9% County = Brunswick County
Cases reported = 2,554
Population = 136,744
% of population reported positive = 1.9% County = Brunswick County
Cases reported = 2,554
Population = 136,744
% of population reported positive = 1.9% County = Brunswick County
Cases reported = 2,554
Population = 136,744
% of population reported positive = 1.9% County = Brunswick County
Cases reported = 2,554
Population = 136,744
% of population reported positive = 1.9% County = Brunswick County
Cases reported = 2,554
Population = 136,744
% of population reported positive = 1.9% County = Brunswick County
Cases reported = 2,554
Population = 136,744
% of population reported positive = 1.9% County = Brunswick County
Cases reported = 2,554
Population = 136,744
% of population reported positive = 1.9% County = Brunswick County
Cases reported = 2,554
Population = 136,744
% of population reported positive = 1.9% County = Brunswick County
Cases reported = 2,554
Population = 136,744
% of population reported positive = 1.9% County = Brunswick County
Cases reported = 2,554
Population = 136,744
% of population reported positive = 1.9% County = Brunswick County
Cases reported = 2,554
Population = 136,744
% of population reported positive = 1.9% County = Brunswick County
Cases reported = 2,554
Population = 136,744
% of population reported positive = 1.9% County = Brunswick County
Cases reported = 2,554
Population = 136,744
% of population reported positive = 1.9% County = Brunswick County
Cases reported = 2,554
Population = 136,744
% of population reported positive = 1.9% County = Brunswick County
Cases reported = 2,554
Population = 136,744
% of population reported positive = 1.9% County = Brunswick County
Cases reported = 2,554
Population = 136,744
% of population reported positive = 1.9% County = Brunswick County
Cases reported = 2,554
Population = 136,744
% of population reported positive = 1.9% County = Brunswick County
Cases reported = 2,554
Population = 136,744
% of population reported positive = 1.9% County = Brunswick County
Cases reported = 2,554
Population = 136,744
% of population reported positive = 1.9%
The SGMap Procedure


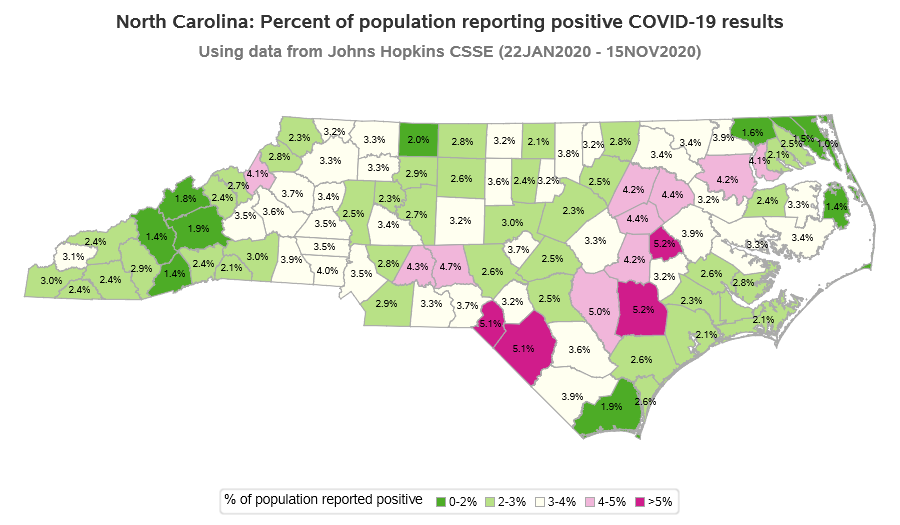
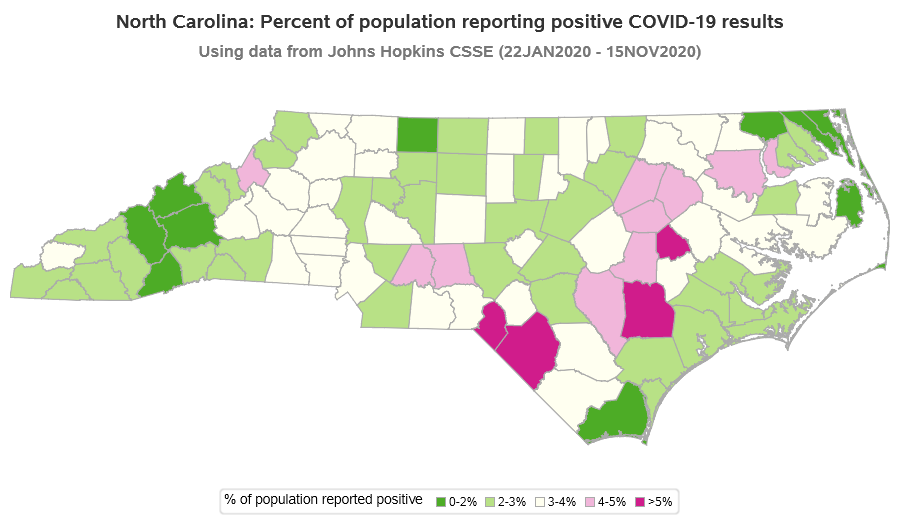
North Carolina: Percent of population reporting positive COVID-19 results
Using data from Johns Hopkins CSSE (22JAN2020 - 15NOV2020)

Obs County Cases reported Population % of population
reported positive
1 Alamance County 6,069 166,436 3.6%
2 Alexander County 1,280 37,353 3.4%
3 Alleghany County 359 11,161 3.2%
4 Anson County 815 24,877 3.3%
5 Ashe County 629 27,109 2.3%
6 Avery County 724 17,505 4.1%
7 Beaufort County 1,544 47,079 3.3%
8 Bertie County 795 19,026 4.2%
9 Bladen County 1,187 33,190 3.6%
10 Brunswick County 2,554 136,744 1.9%
11 Buncombe County 4,800 259,103 1.9%
12 Burke County 3,214 90,382 3.6%
13 Cabarrus County 5,864 211,342 2.8%
14 Caldwell County 3,036 82,029 3.7%
15 Camden County 158 10,710 1.5%
16 Carteret County 1,435 69,524 2.1%
17 Caswell County 723 22,698 3.2%
18 Catawba County 5,613 158,652 3.5%
19 Chatham County 2,171 73,139 3.0%
20 Cherokee County 854 28,383 3.0%
21 Chowan County 572 14,029 4.1%
22 Clay County 265 11,139 2.4%
23 Cleveland County 3,765 97,645 3.9%
24 Columbus County 2,183 55,655 3.9%
25 Craven County 2,693 102,912 2.6%
26 Cumberland County 8,214 332,330 2.5%
27 Currituck County 276 27,072 1.0%
28 Dare County 523 36,501 1.4%
29 Davidson County 4,423 166,614 2.7%
30 Davie County 970 42,733 2.3%
31 Duplin County 3,053 58,856 5.2%
32 Durham County 10,250 316,739 3.2%
33 Edgecombe County 2,291 52,005 4.4%
34 Forsyth County 10,938 379,099 2.9%
35 Franklin County 1,713 67,560 2.5%
36 Gaston County 8,874 222,846 4.0%
37 Gates County 184 11,573 1.6%
38 Graham County 265 8,484 3.1%
39 Granville County 2,283 60,115 3.8%
40 Greene County 1,097 21,012 5.2%
41 Guilford County 14,022 533,670 2.6%
42 Halifax County 1,714 50,574 3.4%
43 Harnett County 3,414 134,214 2.5%
44 Haywood County 865 61,971 1.4%
45 Henderson County 2,796 116,748 2.4%
46 Hertford County 912 23,659 3.9%
47 Hoke County 1,759 54,764 3.2%
48 Hyde County 179 5,230 3.4%
49 Iredell County 4,550 178,435 2.5%
50 Jackson County 1,277 43,327 2.9%
51 Johnston County 6,610 202,675 3.3%
52 Jones County 219 9,637 2.3%
53 Lee County 2,281 61,452 3.7%
54 Lenoir County 1,767 55,976 3.2%
55 Lincoln County 2,916 83,770 3.5%
56 Macon County 846 35,285 2.4%
57 Madison County 390 21,763 1.8%
58 Martin County 732 22,671 3.2%
59 McDowell County 1,571 45,507 3.5%
60 Mecklenburg County 38,295 1,093,901 3.5%
61 Mitchell County 402 15,000 2.7%
62 Montgomery County 1,282 27,271 4.7%
63 Moore County 2,556 98,682 2.6%
64 Nash County 3,962 94,016 4.2%
65 New Hanover County 6,134 232,274 2.6%
66 Northampton County 671 19,676 3.4%
67 Onslow County 4,176 197,683 2.1%
68 Orange County 3,502 146,027 2.4%
69 Pamlico County 357 12,670 2.8%
70 Pasquotank County 990 39,639 2.5%
71 Pender County 1,616 62,162 2.6%
72 Perquimans County 288 13,422 2.1%
73 Person County 828 39,507 2.1%
74 Pitt County 7,015 179,914 3.9%
75 Polk County 430 20,611 2.1%
76 Randolph County 4,626 143,351 3.2%
77 Richmond County 1,640 44,887 3.7%
78 Robeson County 6,702 131,831 5.1%
79 Rockingham County 2,556 90,690 2.8%
80 Rowan County 4,870 141,262 3.4%
81 Rutherford County 1,982 66,826 3.0%
82 Sampson County 3,206 63,626 5.0%
83 Scotland County 1,760 34,810 5.1%
84 Stanly County 2,682 62,075 4.3%
85 Stokes County 905 45,467 2.0%
86 Surry County 2,351 71,948 3.3%
87 Swain County 335 14,245 2.4%
88 Transylvania County 485 34,215 1.4%
89 Tyrrell County 135 4,131 3.3%
90 Union County 6,818 235,908 2.9%
91 Vance County 1,444 44,582 3.2%
92 Wake County 24,703 1,092,305 2.3%
93 Warren County 549 19,807 2.8%
94 Washington County 285 11,859 2.4%
95 Watauga County 1,580 55,945 2.8%
96 Wayne County 5,165 123,248 4.2%
97 Wilkes County 2,250 68,557 3.3%
98 Wilson County 3,554 81,455 4.4%
99 Yadkin County 1,250 37,543 3.3%
100 Yancey County 421 17,903 2.4%