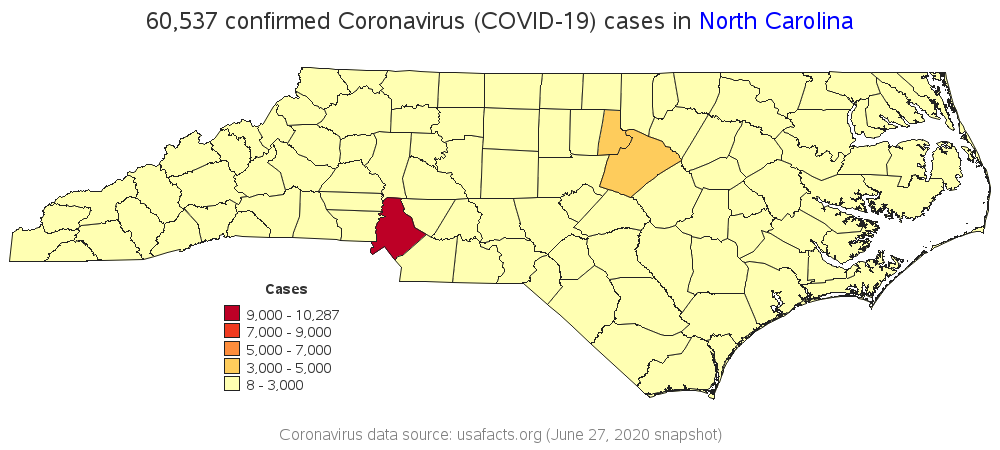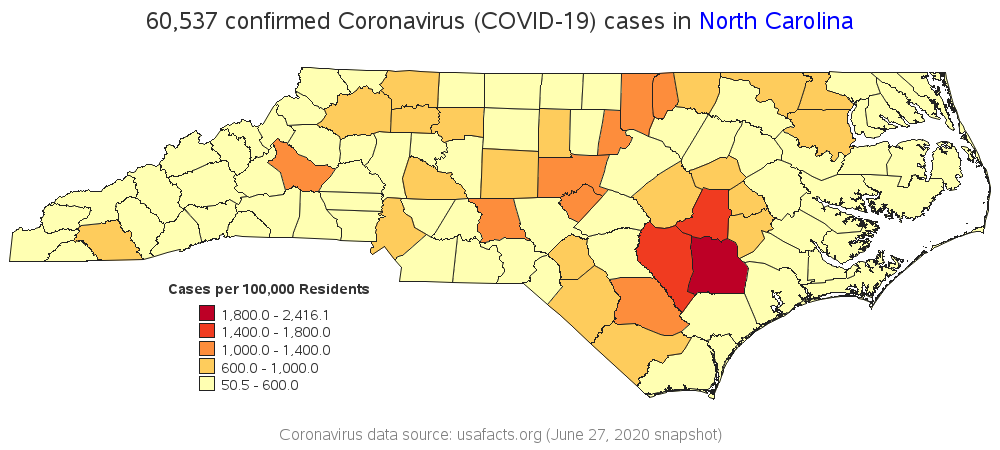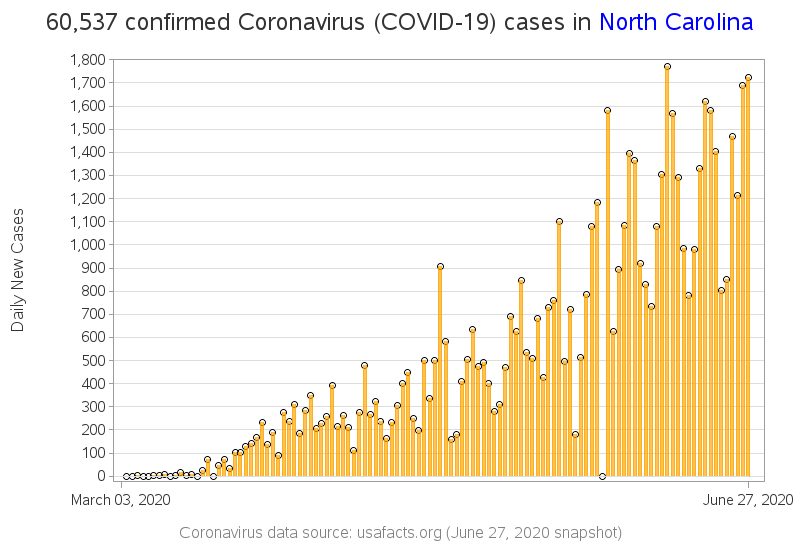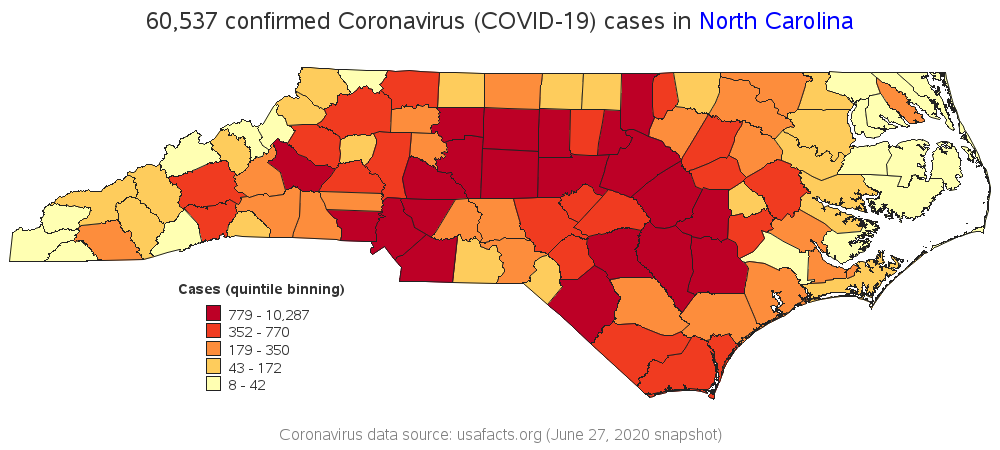
| 60,537 confirmed Coronavirus (COVID-19) cases in North Carolina |
| Obs | County | Coronavirus cases | Population (2018) | Cases per 100,000 residents |
Percent of residents with Coronavirus |
|---|---|---|---|---|---|
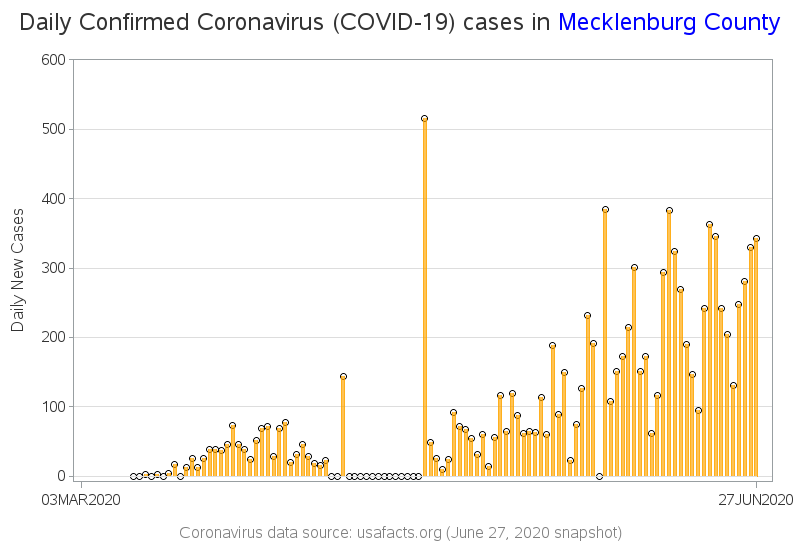
| 1 | Mecklenburg County | 10,287 | 1,093,901 | 940.396 | 0.940396% |
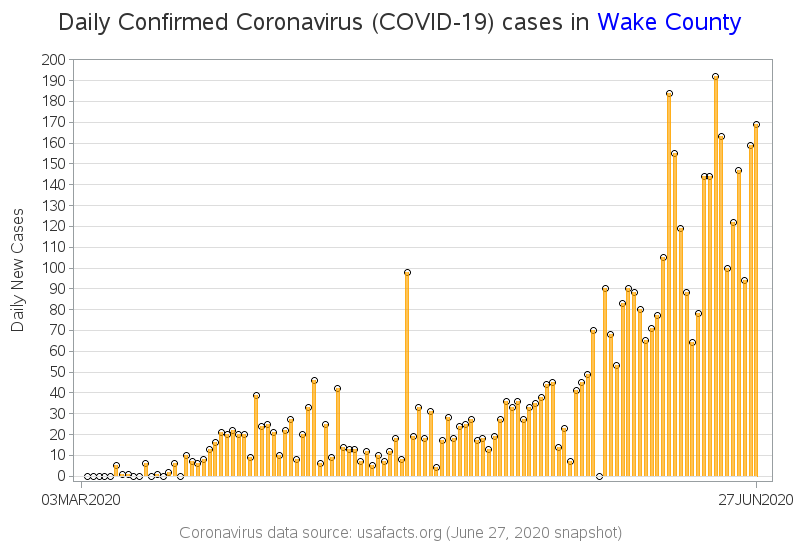
| 2 | Wake County | 4,675 | 1,092,305 | 427.994 | 0.427994% |
| 3 | Durham County | 3,521 | 316,739 | 1,111.641 | 1.111641% |
| 4 | Forsyth County | 2,871 | 379,099 | 757.322 | 0.757322% |
| 5 | Guilford County | 2,690 | 533,670 | 504.057 | 0.504057% |
| 6 | Wayne County | 1,740 | 123,248 | 1,411.788 | 1.411788% |
| 7 | Duplin County | 1,422 | 58,856 | 2,416.066 | 2.416066% |
| 8 | Johnston County | 1,346 | 202,675 | 664.117 | 0.664117% |
| 9 | Robeson County | 1,161 | 131,831 | 880.673 | 0.880673% |
| 10 | Randolph County | 1,137 | 143,351 | 793.158 | 0.793158% |
| 11 | Rowan County | 1,137 | 141,262 | 804.887 | 0.804887% |
| 12 | Union County | 1,123 | 235,908 | 476.033 | 0.476033% |
| 13 | Cumberland County | 1,101 | 332,330 | 331.297 | 0.331297% |
| 14 | Alamance County | 1,066 | 166,436 | 640.486 | 0.640486% |
| 15 | Cabarrus County | 1,021 | 211,342 | 483.103 | 0.483103% |
| 16 | Burke County | 1,000 | 90,382 | 1,106.415 | 1.106415% |
| 17 | Sampson County | 986 | 63,626 | 1,549.681 | 1.549681% |
| 18 | Gaston County | 972 | 222,846 | 436.176 | 0.436176% |
| 19 | Chatham County | 924 | 73,139 | 1,263.348 | 1.263348% |
| 20 | Davidson County | 908 | 166,614 | 544.972 | 0.544972% |
| 21 | Granville County | 779 | 60,115 | 1,295.850 | 1.295850% |
| 22 | Lee County | 770 | 61,452 | 1,253.010 | 1.253010% |
| 23 | New Hanover County | 750 | 232,274 | 322.895 | 0.322895% |
| 24 | Iredell County | 707 | 178,435 | 396.223 | 0.396223% |
| 25 | Catawba County | 686 | 158,652 | 432.393 | 0.432393% |
| 26 | Wilson County | 674 | 81,455 | 827.451 | 0.827451% |
| 27 | Pitt County | 650 | 179,914 | 361.284 | 0.361284% |
| 28 | Orange County | 616 | 146,027 | 421.840 | 0.421840% |
| 29 | Harnett County | 598 | 134,214 | 445.557 | 0.445557% |
| 30 | Wilkes County | 567 | 68,557 | 827.049 | 0.827049% |
| 31 | Henderson County | 558 | 116,748 | 477.953 | 0.477953% |
| 32 | Buncombe County | 536 | 259,103 | 206.868 | 0.206868% |
| 33 | Columbus County | 502 | 55,655 | 901.985 | 0.901985% |
| 34 | Vance County | 492 | 44,582 | 1,103.584 | 1.103584% |
| 35 | Brunswick County | 459 | 136,744 | 335.664 | 0.335664% |
| 36 | Surry County | 444 | 71,948 | 617.112 | 0.617112% |
| 37 | Moore County | 421 | 98,682 | 426.623 | 0.426623% |
| 38 | Nash County | 403 | 94,016 | 428.650 | 0.428650% |
| 39 | Caldwell County | 358 | 82,029 | 436.431 | 0.436431% |
| 40 | Lenoir County | 358 | 55,976 | 639.560 | 0.639560% |
| 41 | Hoke County | 352 | 54,764 | 642.758 | 0.642758% |
| 42 | Craven County | 350 | 102,912 | 340.096 | 0.340096% |
| 43 | Bladen County | 349 | 33,190 | 1,051.522 | 1.051522% |
| 44 | Stanly County | 340 | 62,075 | 547.725 | 0.547725% |
| 45 | Franklin County | 326 | 67,560 | 482.534 | 0.482534% |
| 46 | Yadkin County | 306 | 37,543 | 815.065 | 0.815065% |
| 47 | Edgecombe County | 302 | 52,005 | 580.713 | 0.580713% |
| 48 | Halifax County | 291 | 50,574 | 575.394 | 0.575394% |
| 49 | Montgomery County | 284 | 27,271 | 1,041.399 | 1.041399% |
| 50 | Rutherford County | 274 | 66,826 | 410.020 | 0.410020% |
| 51 | Cleveland County | 268 | 97,645 | 274.464 | 0.274464% |
| 52 | Macon County | 266 | 35,285 | 753.861 | 0.753861% |
| 53 | Richmond County | 256 | 44,887 | 570.321 | 0.570321% |
| 54 | Onslow County | 249 | 197,683 | 125.959 | 0.125959% |
| 55 | Pender County | 222 | 62,162 | 357.131 | 0.357131% |
| 56 | Lincoln County | 220 | 83,770 | 262.624 | 0.262624% |
| 57 | McDowell County | 213 | 45,507 | 468.060 | 0.468060% |
| 58 | Rockingham County | 210 | 90,690 | 231.558 | 0.231558% |
| 59 | Pasquotank County | 198 | 39,639 | 499.508 | 0.499508% |
| 60 | Davie County | 183 | 42,733 | 428.240 | 0.428240% |
| 61 | Northampton County | 179 | 19,676 | 909.738 | 0.909738% |
| 62 | Greene County | 172 | 21,012 | 818.580 | 0.818580% |
| 63 | Hertford County | 160 | 23,659 | 676.275 | 0.676275% |
| 64 | Warren County | 157 | 19,807 | 792.649 | 0.792649% |
| 65 | Bertie County | 141 | 19,026 | 741.091 | 0.741091% |
| 66 | Caswell County | 134 | 22,698 | 590.360 | 0.590360% |
| 67 | Scotland County | 133 | 34,810 | 382.074 | 0.382074% |
| 68 | Stokes County | 124 | 45,467 | 272.725 | 0.272725% |
| 69 | Anson County | 121 | 24,877 | 486.393 | 0.486393% |
| 70 | Martin County | 120 | 22,671 | 529.311 | 0.529311% |
| 71 | Person County | 103 | 39,507 | 260.713 | 0.260713% |
| 72 | Jackson County | 91 | 43,327 | 210.031 | 0.210031% |
| 73 | Haywood County | 86 | 61,971 | 138.775 | 0.138775% |
| 74 | Alexander County | 84 | 37,353 | 224.882 | 0.224882% |
| 75 | Beaufort County | 74 | 47,079 | 157.183 | 0.157183% |
| 76 | Carteret County | 70 | 69,524 | 100.685 | 0.100685% |
| 77 | Polk County | 68 | 20,611 | 329.921 | 0.329921% |
| 78 | Watauga County | 58 | 55,945 | 103.673 | 0.103673% |
| 79 | Ashe County | 52 | 27,109 | 191.818 | 0.191818% |
| 80 | Swain County | 51 | 14,245 | 358.020 | 0.358020% |
| 81 | Yancey County | 43 | 17,903 | 240.183 | 0.240183% |
| 82 | Dare County | 42 | 36,501 | 115.065 | 0.115065% |
| 83 | Washington County | 38 | 11,859 | 320.432 | 0.320432% |
| 84 | Perquimans County | 36 | 13,422 | 268.216 | 0.268216% |
| 85 | Cherokee County | 33 | 28,383 | 116.267 | 0.116267% |
| 86 | Jones County | 32 | 9,637 | 332.054 | 0.332054% |
| 87 | Alleghany County | 31 | 11,161 | 277.753 | 0.277753% |
| 88 | Mitchell County | 27 | 15,000 | 180.000 | 0.180000% |
| 89 | Gates County | 26 | 11,573 | 224.661 | 0.224661% |
| 90 | Camden County | 24 | 10,710 | 224.090 | 0.224090% |
| 91 | Chowan County | 22 | 14,029 | 156.818 | 0.156818% |
| 92 | Transylvania County | 20 | 34,215 | 58.454 | 0.058454% |
| 93 | Statewide Unallocated | 19 | . | . | . |
| 94 | Currituck County | 18 | 27,072 | 66.489 | 0.066489% |
| 95 | Pamlico County | 18 | 12,670 | 142.068 | 0.142068% |
| 96 | Madison County | 11 | 21,763 | 50.545 | 0.050545% |
| 97 | Avery County | 9 | 17,505 | 51.414 | 0.051414% |
| 98 | Clay County | 9 | 11,139 | 80.797 | 0.080797% |
| 99 | Graham County | 9 | 8,484 | 106.082 | 0.106082% |
| 100 | Hyde County | 9 | 5,230 | 172.084 | 0.172084% |
| 101 | Tyrrell County | 8 | 4,131 | 193.658 | 0.193658% |
| 60,537 | 10,383,620 |
| Coronavirus data source: usafacts.org (June 27, 2020 snapshot) |